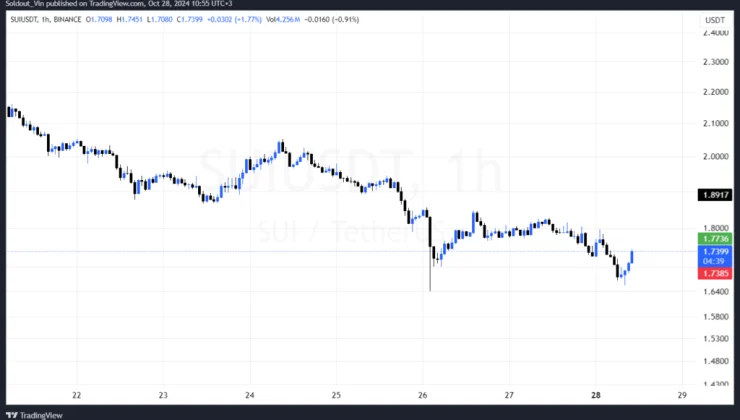

The SUI cryptocurrency has captured market attention recently, primarily due to its significant price correction (a 6% drop over the past 24 hours) despite an impressive increase in daily inflows. This seemingly paradoxical trend raises questions about the current state of SUI and whether the correction phase is nearing its end. Some analysts caution against buying the dip just yet, suggesting a possible further 20% decline before SUI may find solid support.
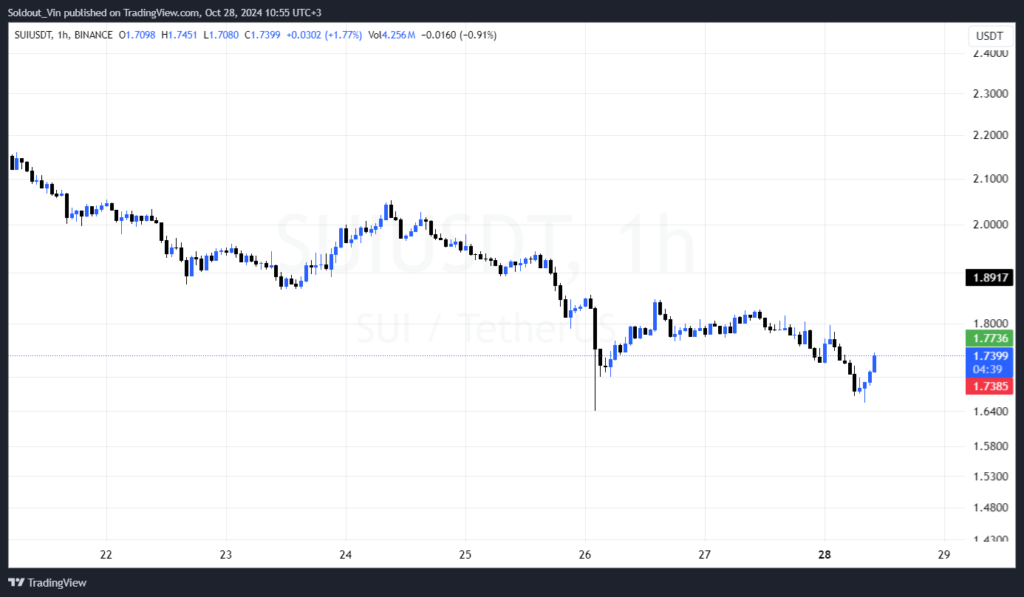
As of 3:52 a.m. EST, SUI is trading at $1.73, reflecting a 6% decrease over the last 24 hours. After hitting resistance at $2.25, buyer fatigue set in, prompting traders to lock in profits, which further pressured the price downward. This trend persists despite Bitcoin’s recent surge to an all-time high of $68,411, which has lifted the broader crypto market by 0.3% in the past day to a total value of $2.428 trillion.
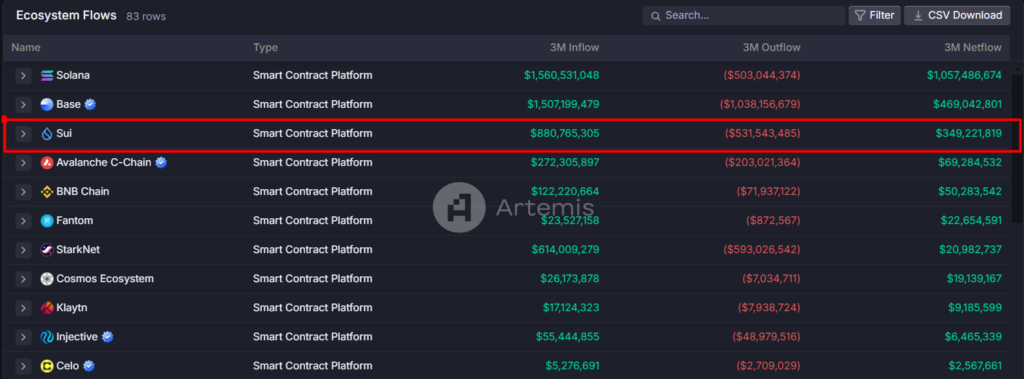
Notably, daily inflows for SUI have surpassed those of Ethereum (ETH), Solana (SOL), and Base, indicating that users are shifting funds from these chains to SUI. Crypto analyst Kyle Chase highlights this trend, stating that SUI is showing strong inflows, which some analysts interpret as a bullish indicator for a potential price reversal. Data from Artemis analytics shows that SUI has outperformed other decentralized networks, ranking third in inflows over the last three months, ahead of notable projects like Ethereum, Avalanche (AVAX), and Fantom (FTM). Additionally, Sui’s team has shared an updated timeline for resolving staking distribution issues, which could help stabilize the price.
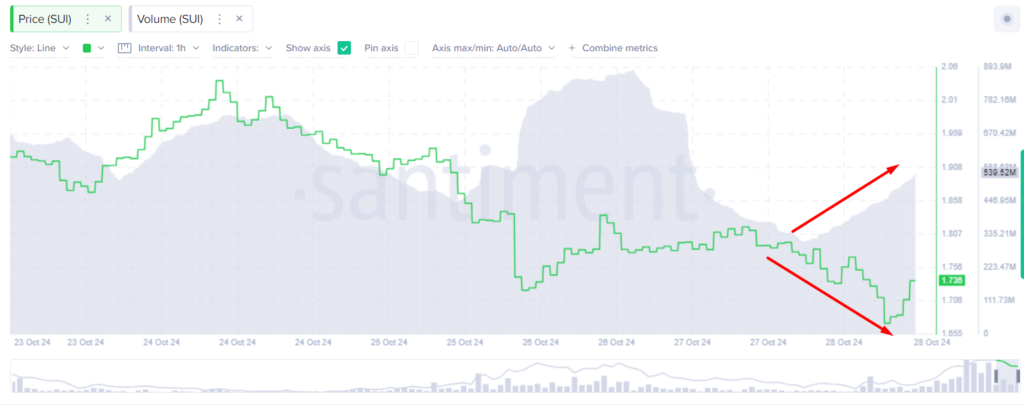
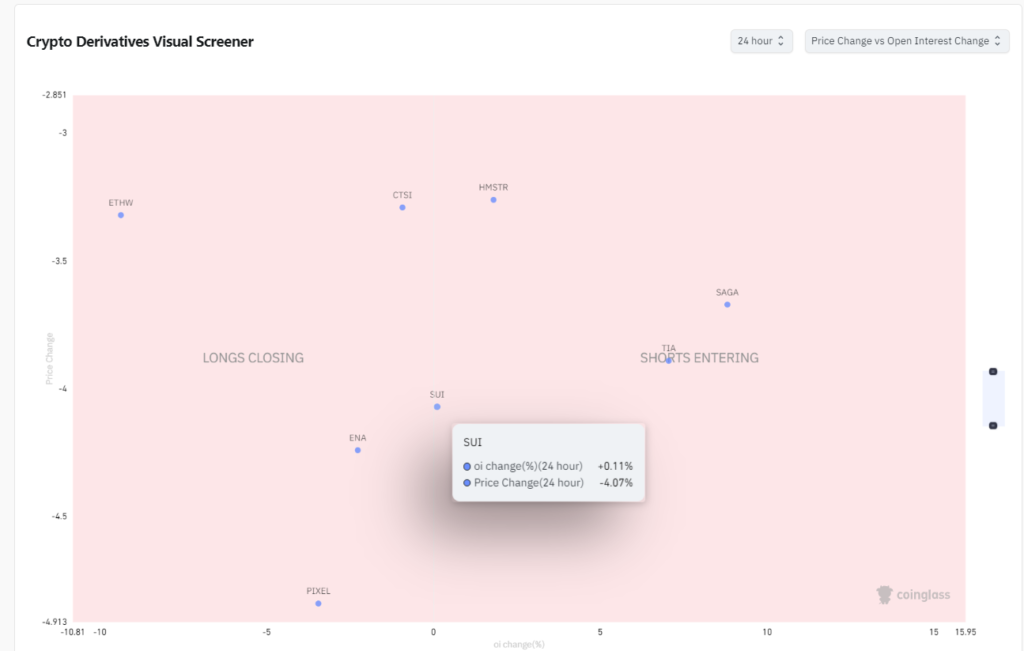
Despite bullish on-chain metrics, a top analyst warns that SUI could see another 20% decline, bringing the price down to the $1.3-$1.36 range. After reaching an all-time high of $2.35 two weeks ago, SUI’s market cap crossed $6 billion, making this correction phase a significant one for SUI holders. Santiment data reveals a 12.2% rise in 24-hour trading volume, suggesting heightened market activity but also increasing selling pressure as prices continue to dip. Further insights from Coinglass show that many traders are closing their SUI long positions at a loss and entering short positions, potentially signaling an extended downtrend in the days ahead.
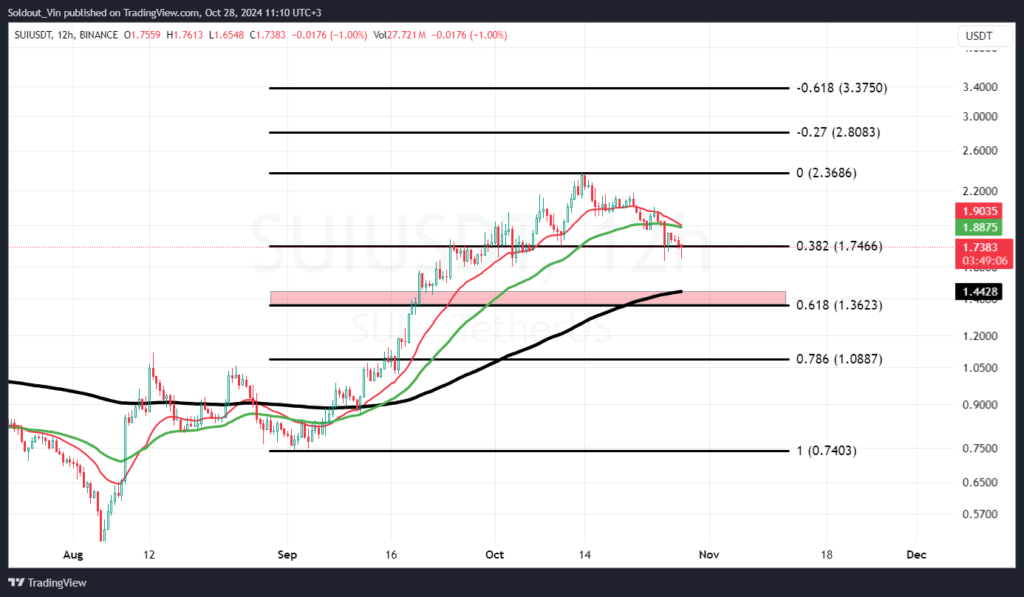
Technical analysis suggests that SUI could eventually reverse its course, though not without a potential 8-20% dip in the meantime. Currently, SUI remains above its 20-day Exponential Moving Average (EMA), which serves as a key support level. Should this support hold, SUI could maintain its long-term bullish outlook, allowing investors some peace of mind amid the current correction.
For now, the 200 EMA sits around $1.44, aligning with the 61.8% Fibonacci retracement level at $1.36, which could offer a robust support zone. Meanwhile, the 38.2% Fibonacci level at $1.74 is showing some support as bulls attempt to sustain the price. However, bears remain active, and if SUI falls through these levels, the $1.36-$1.44 range may serve as the next critical support zone.
While SUI maintains a bullish outlook overall, the current pullback has created an ideal profit-taking opportunity for early investors. As selling pressure stabilizes and key support levels hold, SUI could see a bounce, potentially setting the stage for a renewed bullish run. For bullish momentum to fully invalidate the bearish outlook, SUI needs to break past $2.36 and establish new highs. Until then, the crypto market remains cautious, watching for signs that SUI’s correction phase is indeed complete.

 1
Memecoins Surge as “Peanut the Squirrel” Becomes a Viral Icon in Solana’s DeFi Market
 2
Strong September Jobs Report Alters Fed Rate Cut Expectations
 3
The Future of Financial Reporting: Crypto News and Emerging Trends in Digital Assets
 4
Crypto Landscape: Job Cuts Amid Financial Gains
 5
Ethereum Researcher Justin Drake Steps Down from Eigen Foundation, Signals Full Commitment to Layer-1 Development